
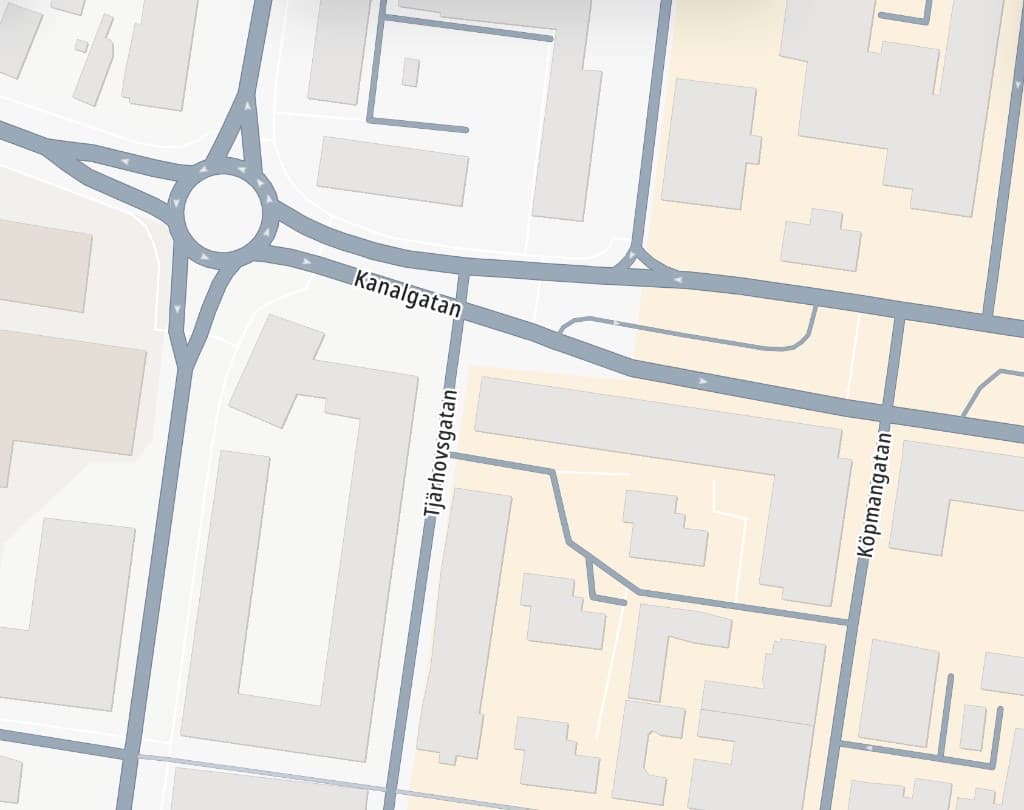
Selected street
Kanalgatan
Vehicles per hour
328veh/h
- Same hour last year
- 290
- Busiest hour
- 08:00
Trusted by






Citywide coverage
See the whole network, not just a few measurement points.
Traffic and parking by street and hour, across the city and throughout the year.
Traditional measurement
Selected locations · Limited periods
Citylytics
Whole network · All year
Explore Citylytics
See each street in context.
Parking demand makes more sense alongside traffic. Revenue makes more sense alongside occupancy. Citylytics lets you see them together across the same streets and times.
Traffic
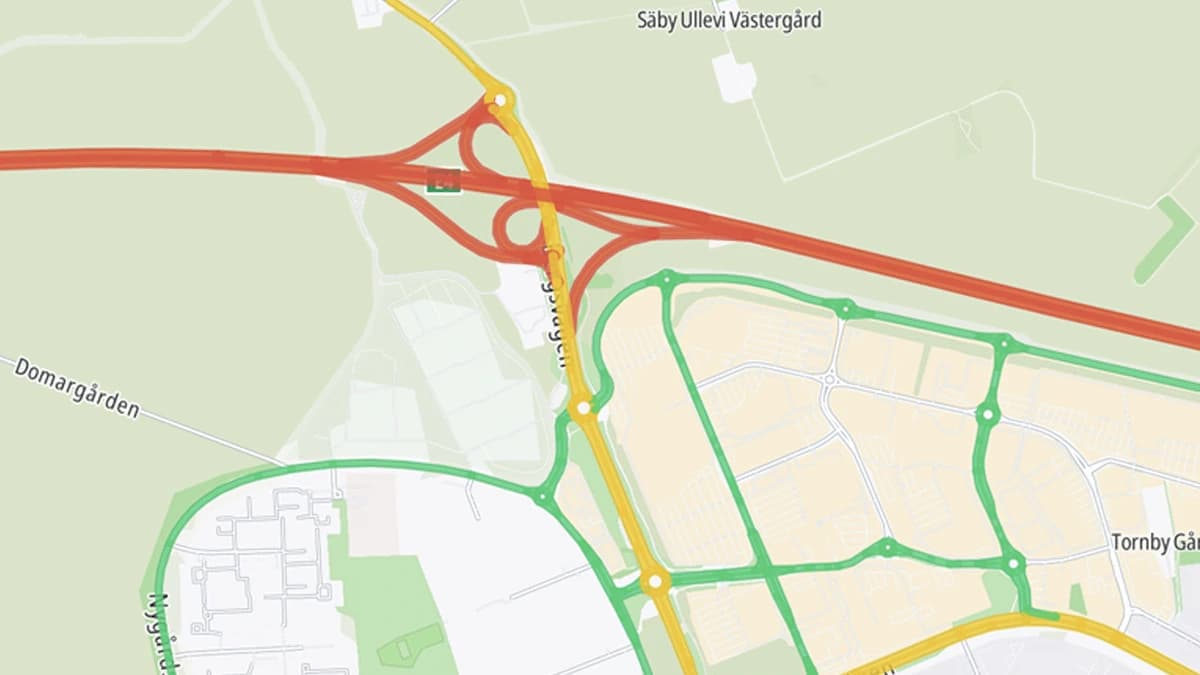
See volumes, speeds and congestion across the street network, with parking and other local conditions available as additional context.
Every streetEvery hourAll yearNo sensors
Analysis
See what happens, where and when.
Compare streets, areas and time periods to see the patterns behind the numbers.
Bridge Street
Traffic
Compare traffic over time across the street network to see where volumes are increasing.
- Traffic change by street segment
- Across the full street network
Largest increase
+14%
Bridge Street, weekday mornings
Method
100+ sources. No sensors.
Our in-house models combine and calibrate open, licensed, geographic and customer-provided data.
Open and public data
Road networks, speed limits, regulations and public transport feeds.
Licensed data
Traffic, movement and incident data from commercial providers.
Geographic data
Street geometry, buildings, land use and points of interest.
Customer-provided data
Traffic counts, parking inventory, payments and enforcement.

- Combine
- Calibrate
- Model
Street-level estimates and analysis
See your city in Citylytics.
Tell us what you are working on and we will tailor the walkthrough around the traffic, parking or mobility questions that matter to you.
Book a walkthrough
No preparation required. We tailor the walkthrough to your questions.